

Portfolio Management
Most AI pilots never fail loudly. They just never get looked at again.
Around 80% of enterprise AI projects fail to deliver the value promised, and it's rarely the model's fault. Usually nobody had a single view of everything in flight.
Portfolio ranks every open initiative by expected readiness impact against real cost and team size, not whoever shouted loudest last meeting. Switch the lens (speed, risk, return per rupee) and the list reorders live.
Demo video coming soon
One ranked list
Every open recommendation and initiative in a single, server-ranked priority order instead of scattered across separate pages.
What-if projection
Select any set of items and see the projected readiness score before you commit a team to them, computed live, nothing persisted until you act.
Impact vs effort matrix
A quadrant view built from your own org's median impact and effort, splitting Quick Wins, Strategic Bets, and Money Pits without a fixed, one-size-fits-all threshold.
Honest gaps, not guesses
Items missing team size or budget are flagged with exactly what's missing rather than silently scored as zero-cost or hidden from the list.
Straight from the platform
See exactly how it works, step by step, below.
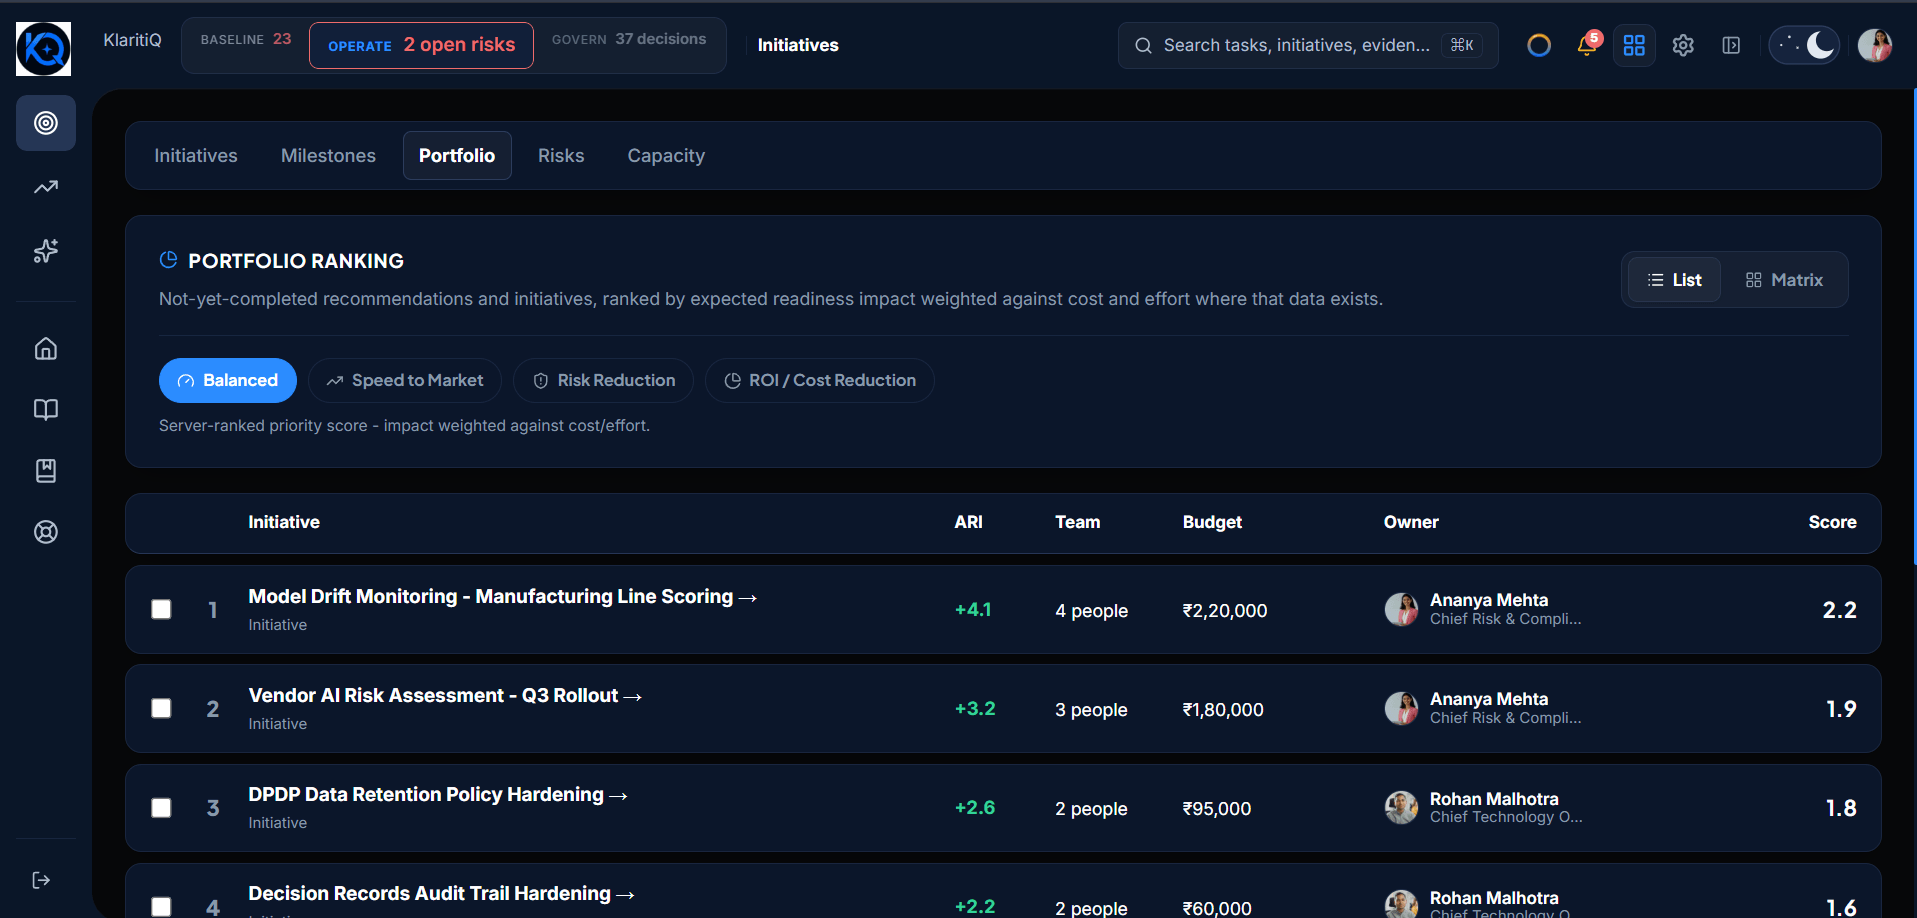
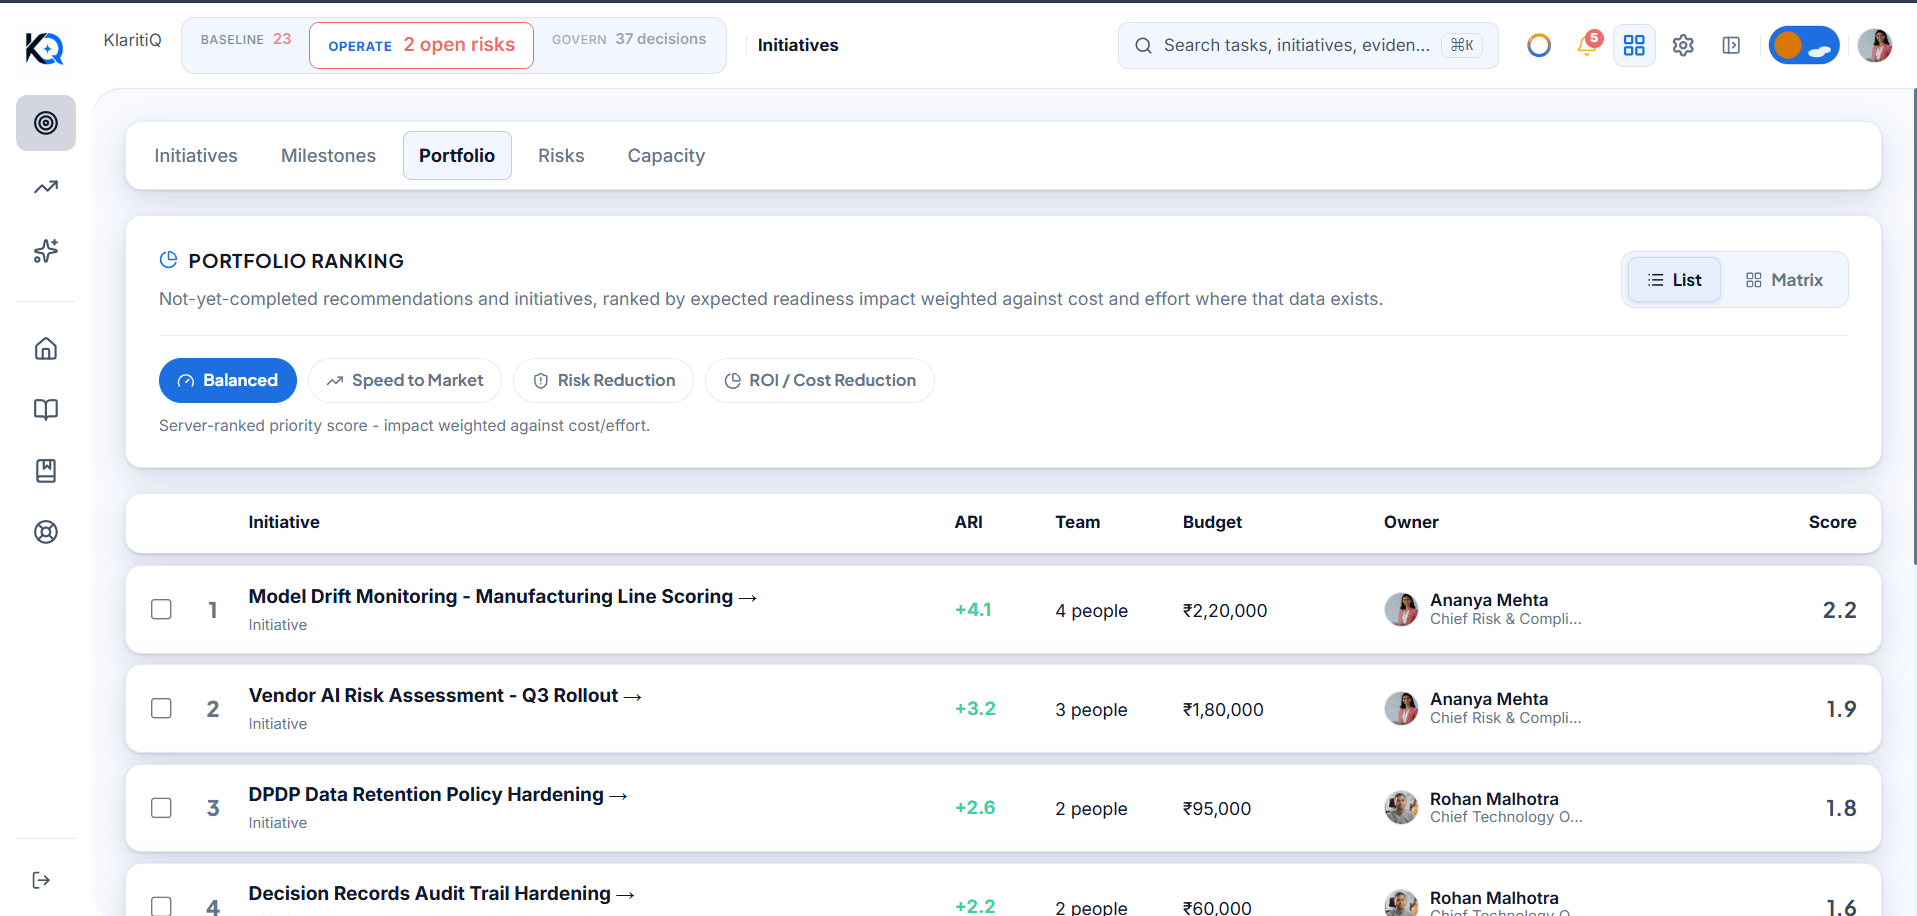
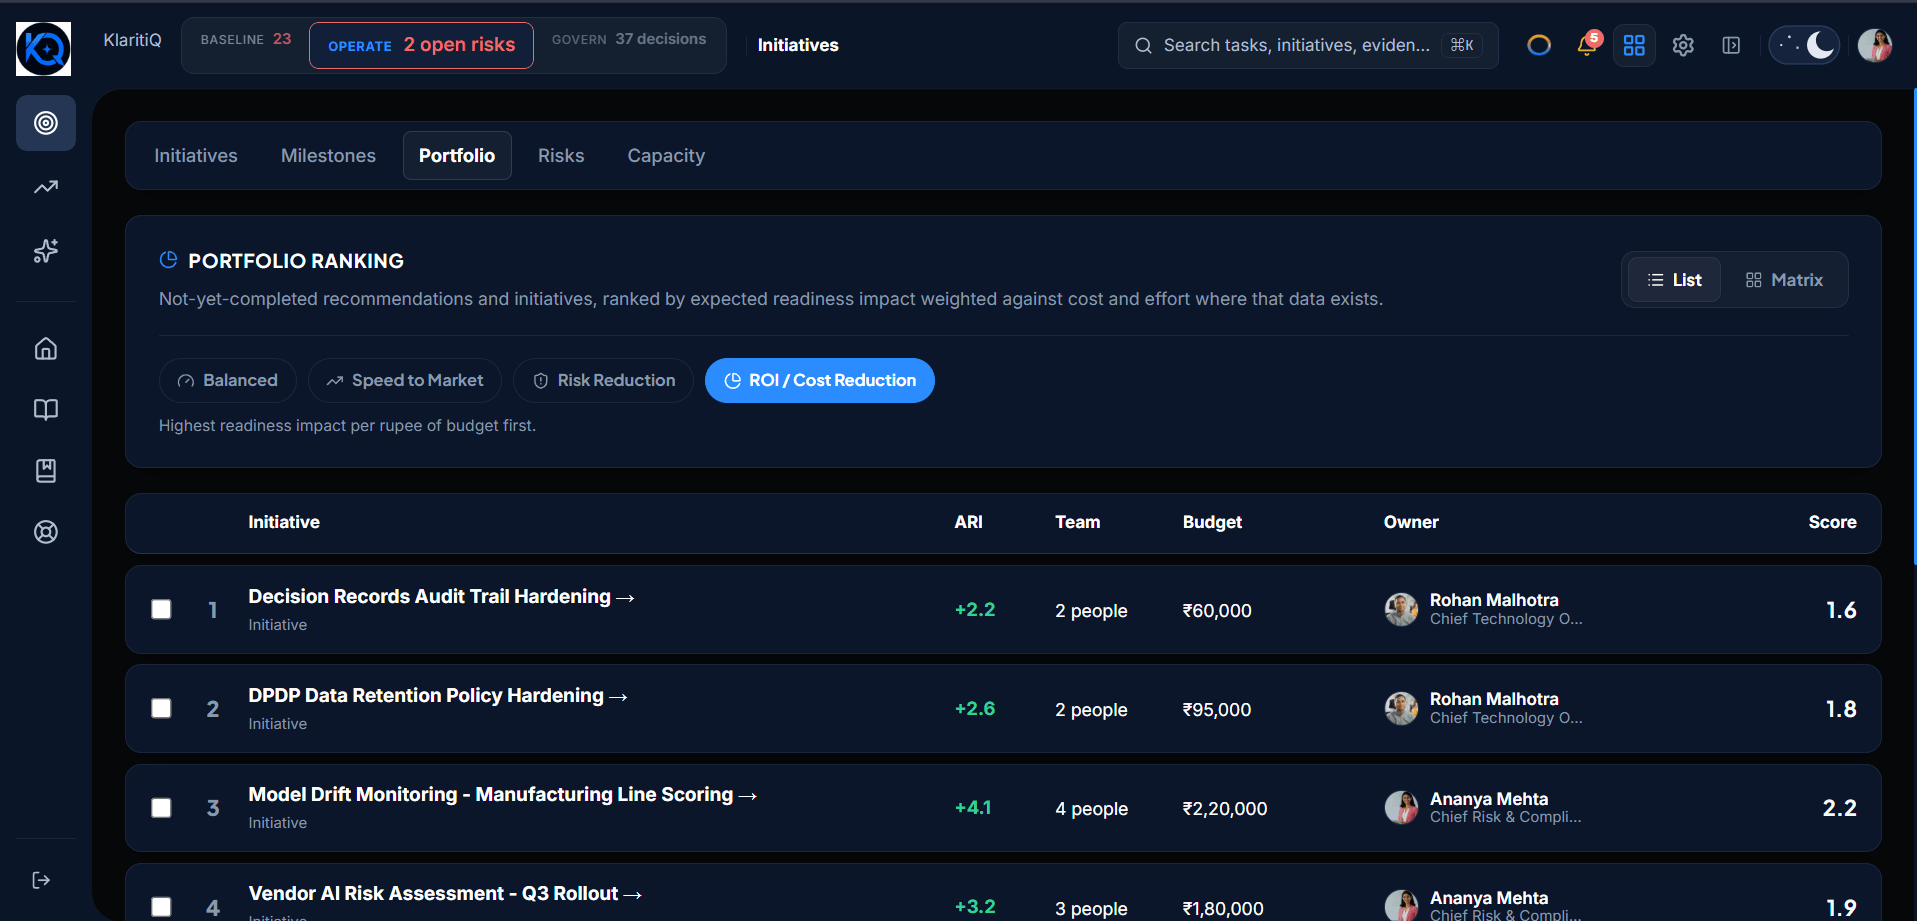
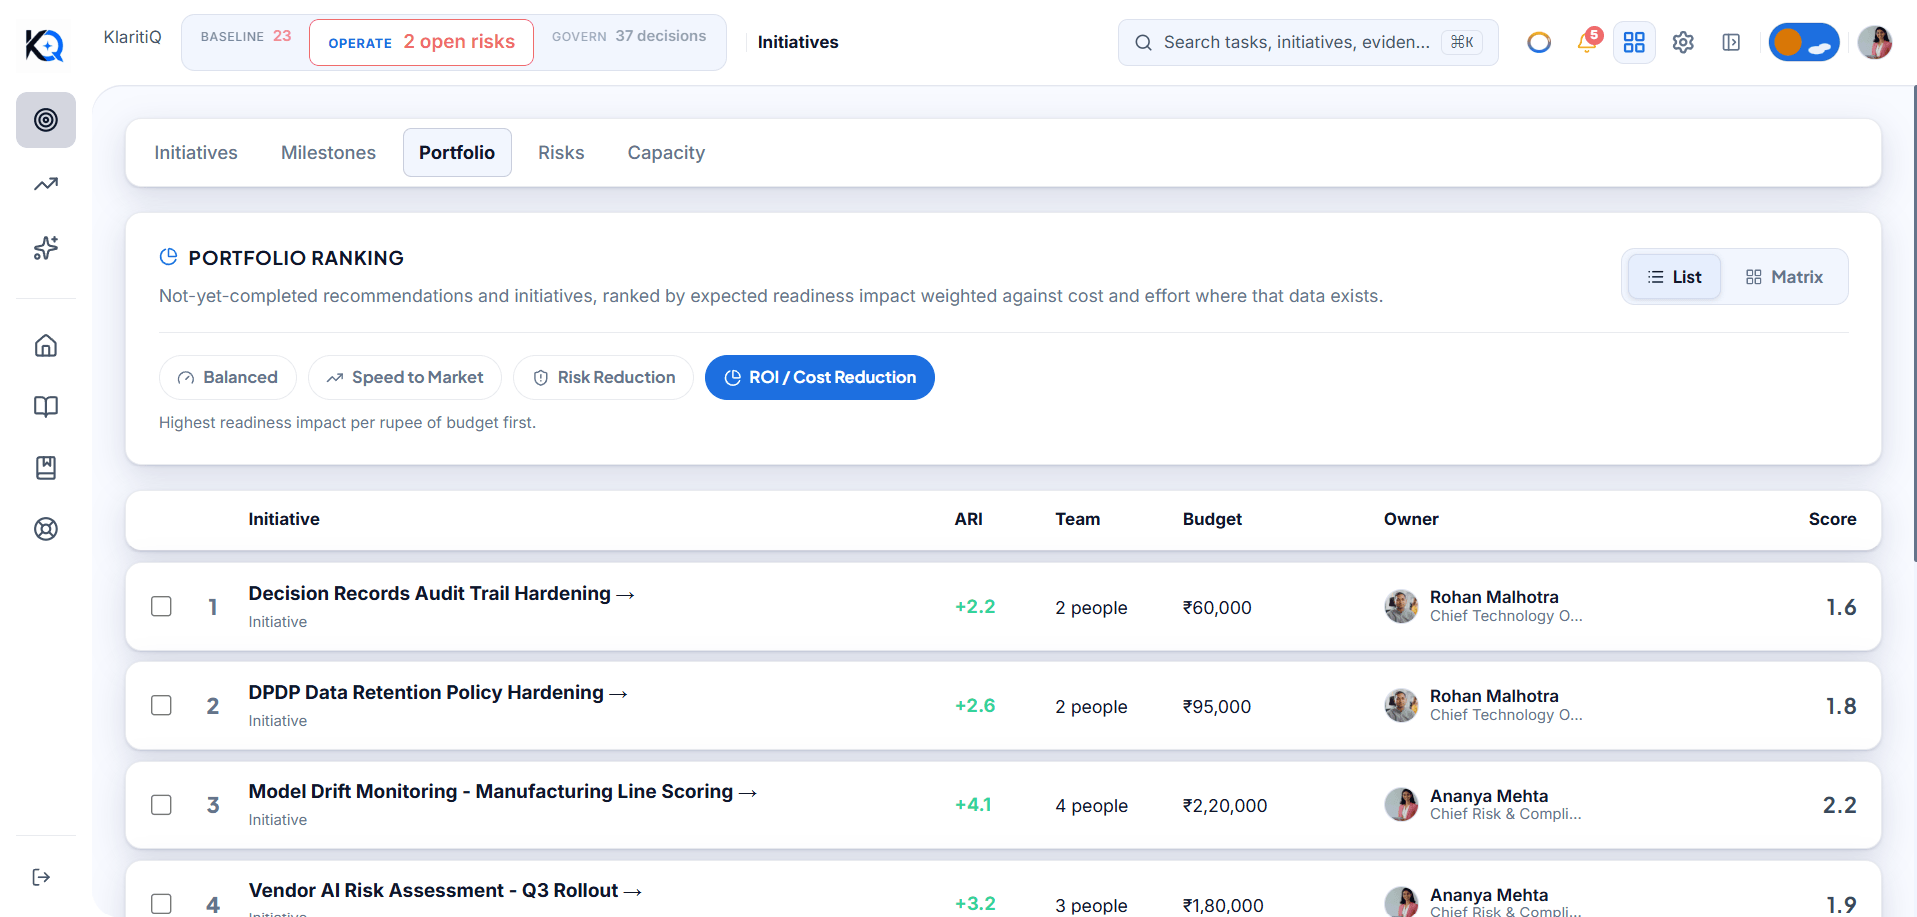
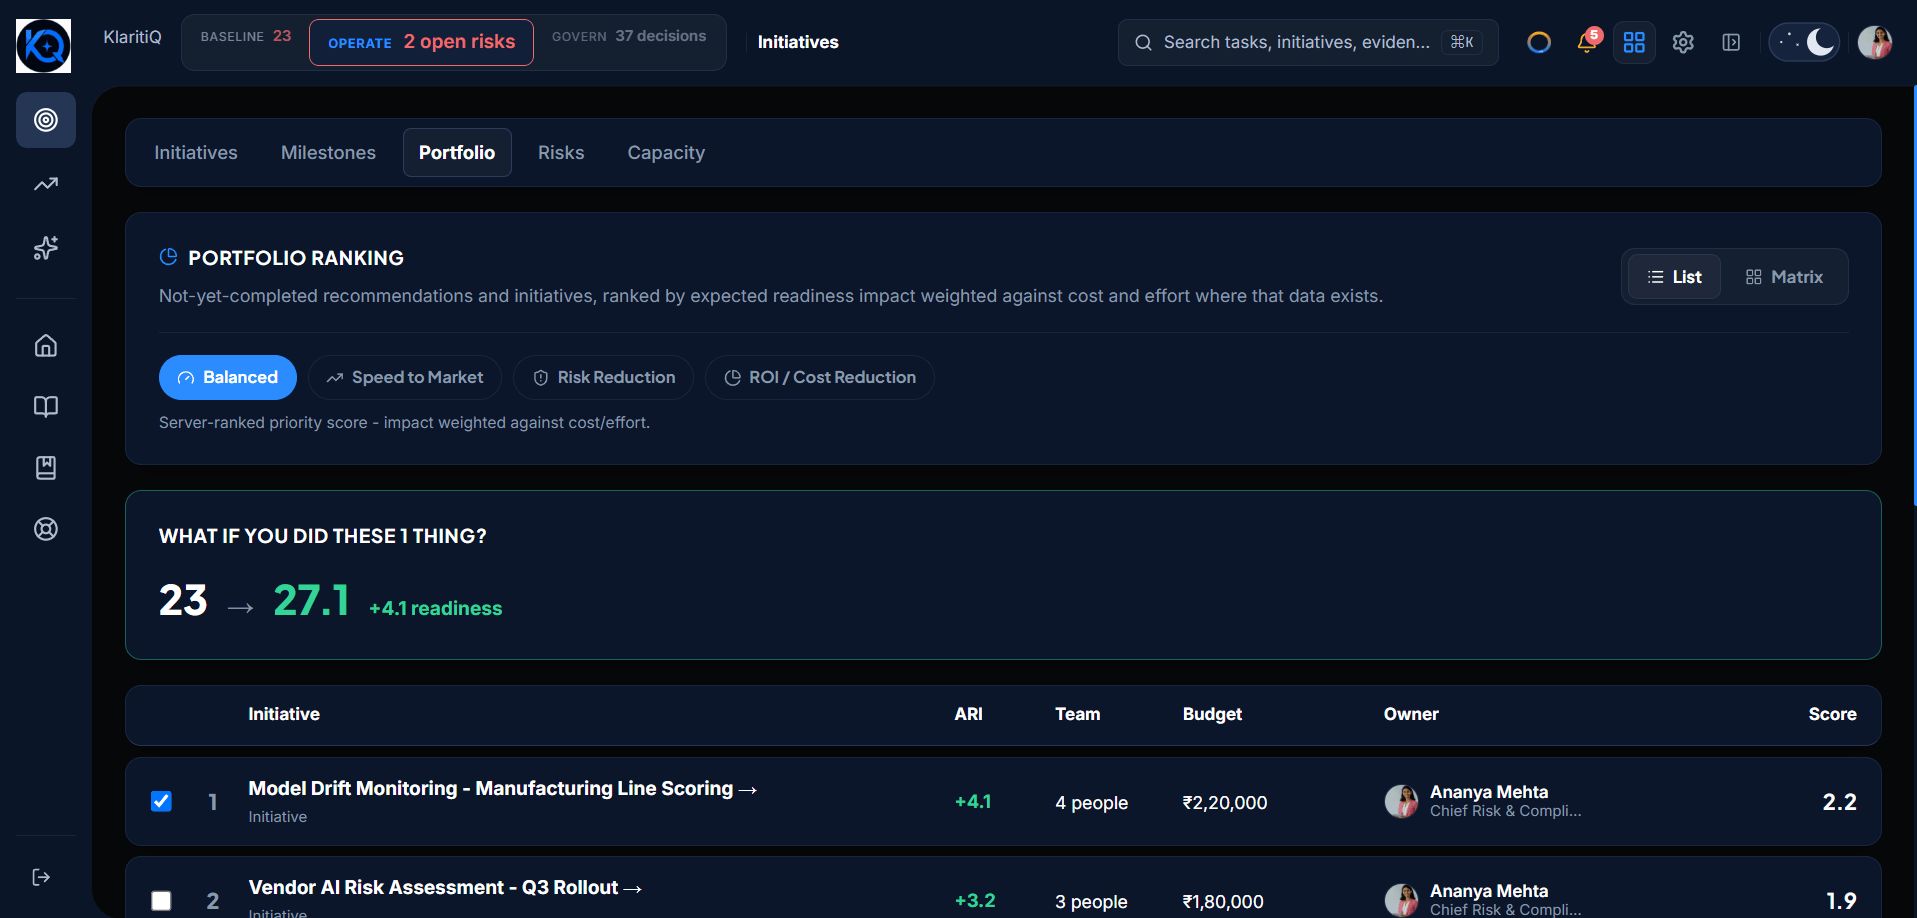
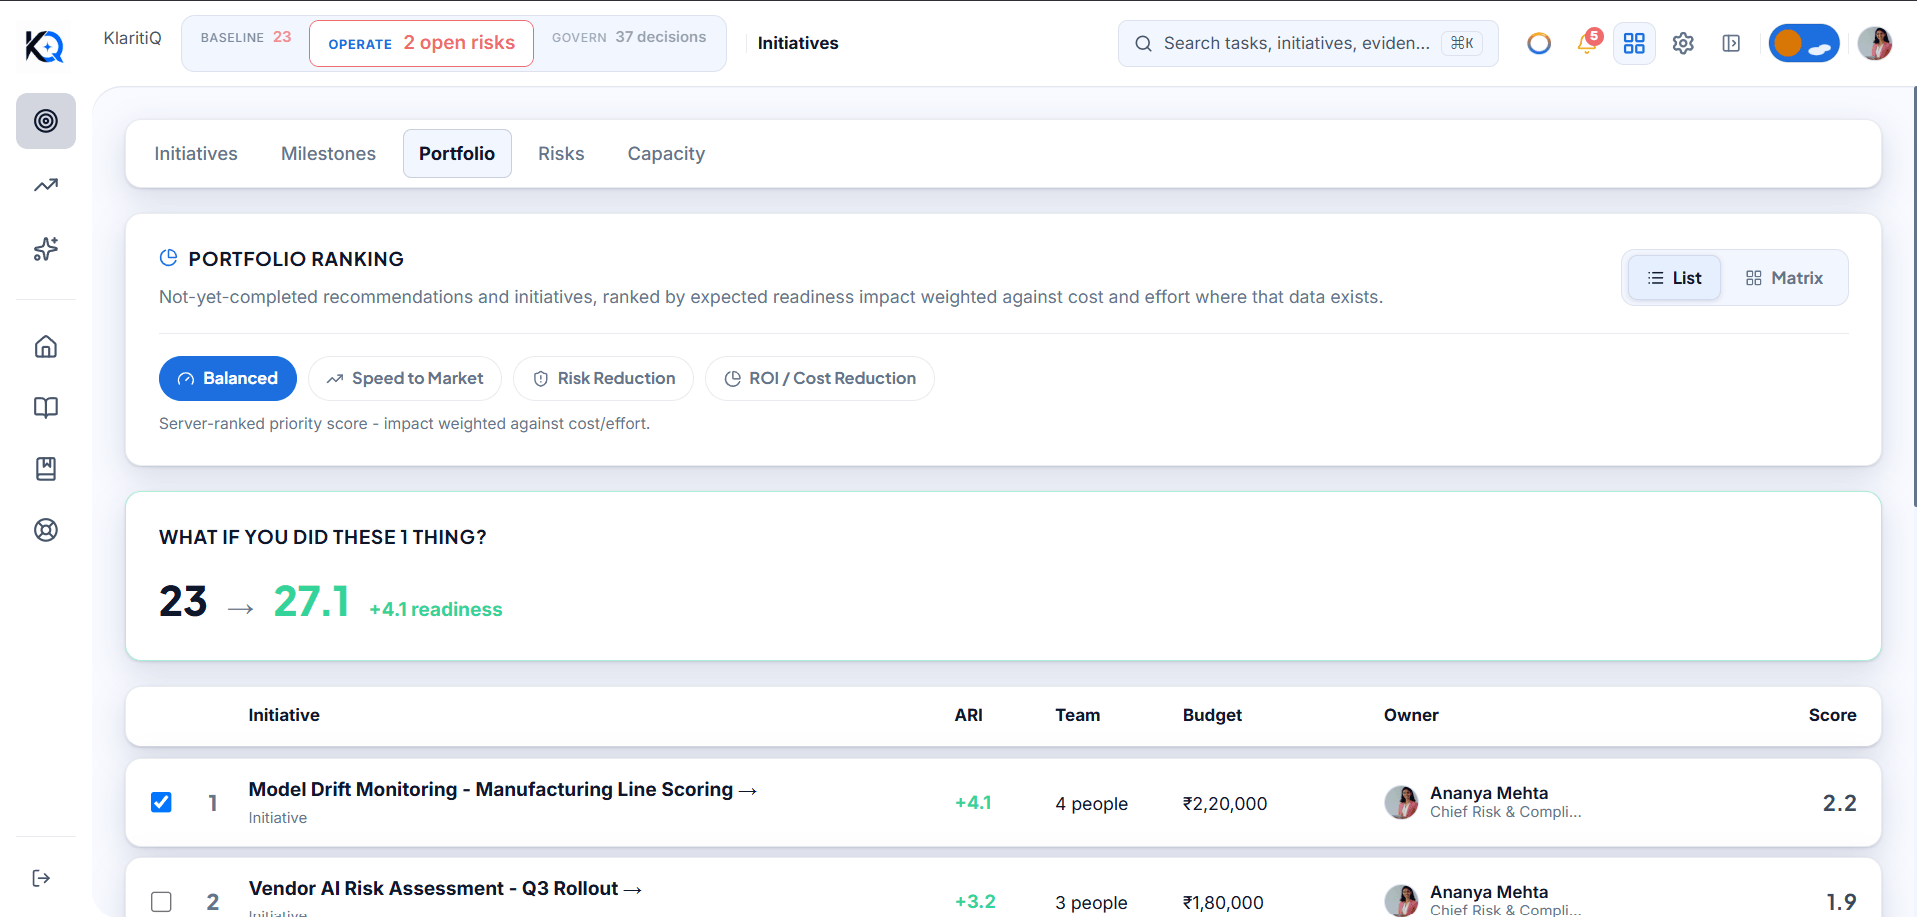
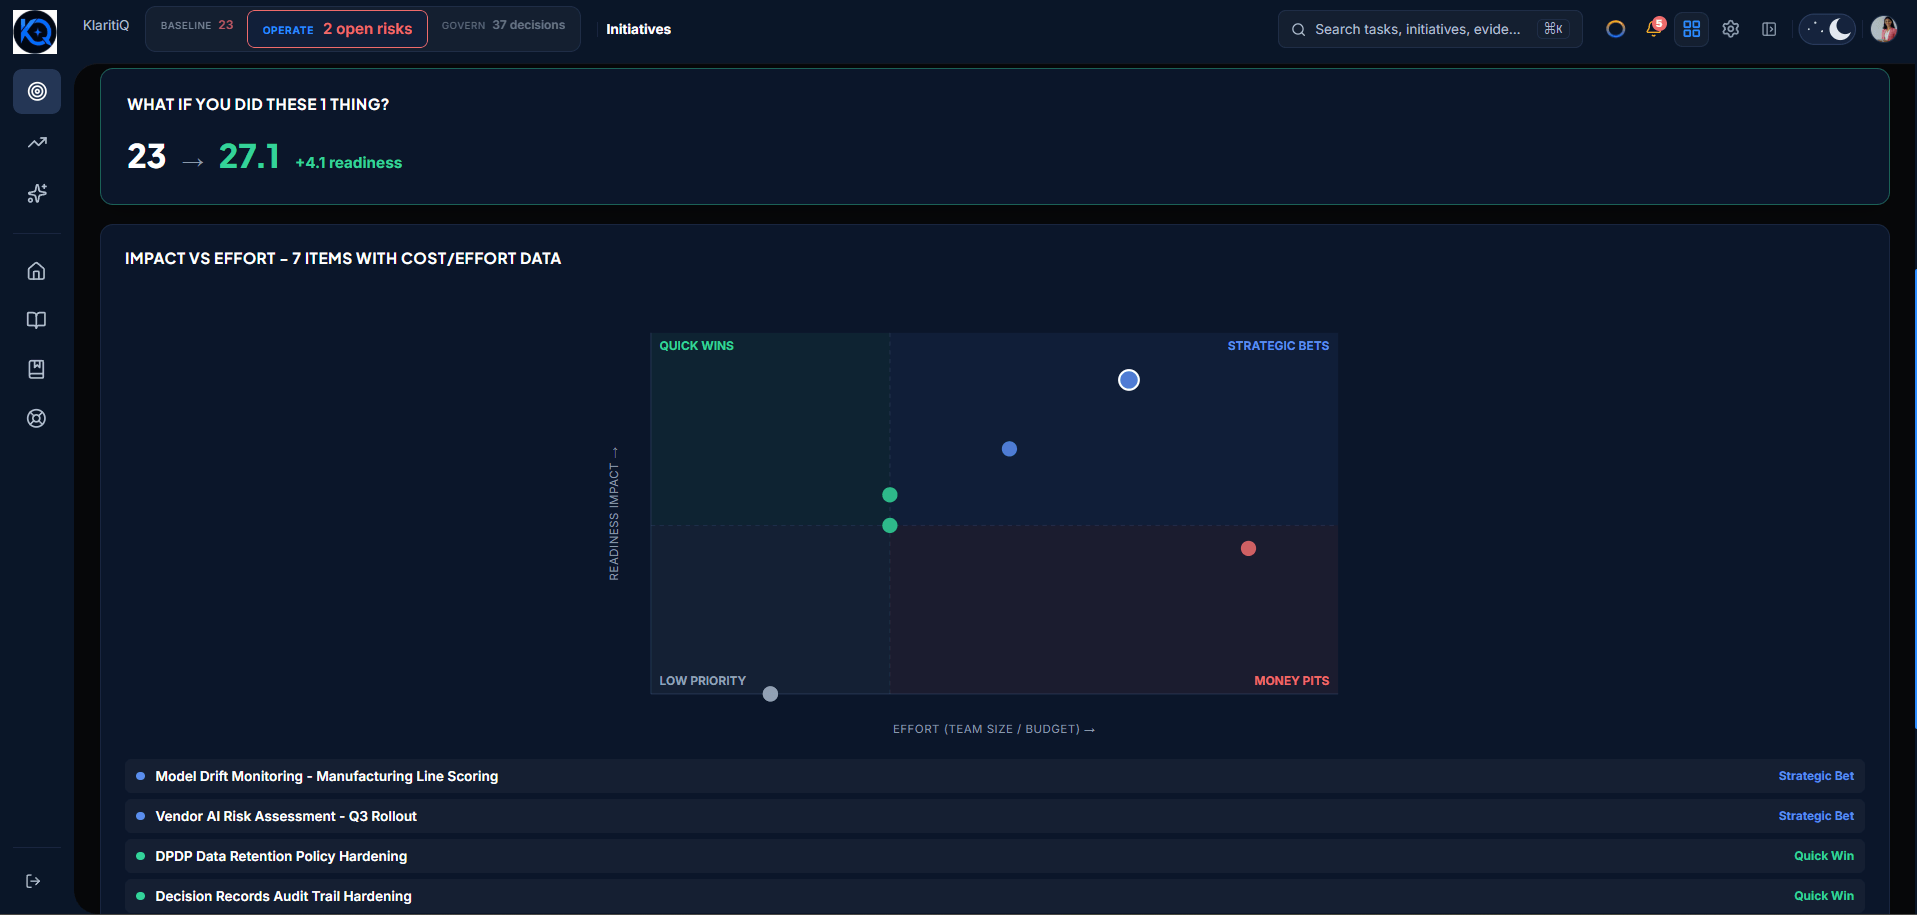
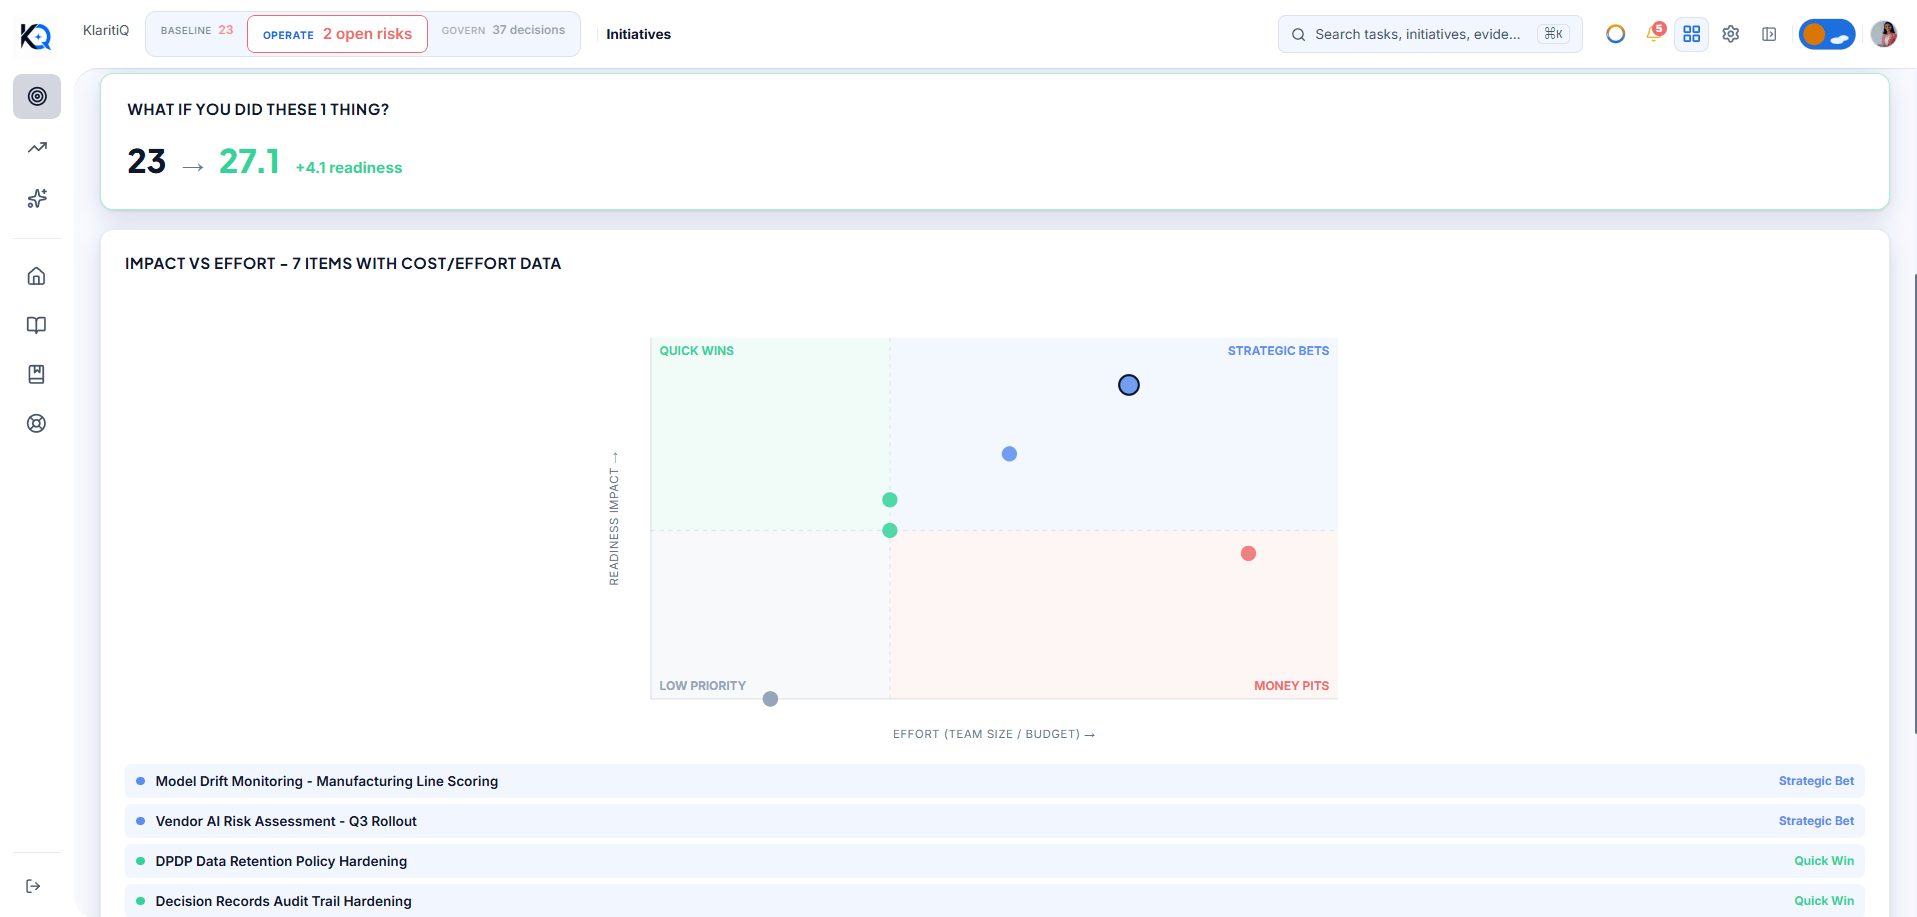
Every open initiative, ranked by expected readiness impact against cost and effort.
How it works
1
Recommendations and initiatives roll up
Every not-yet-completed recommendation and initiative in the org is pulled into one list, each carrying its readiness impact, team size, budget, and open risk count.
2
Pick a lens
Balanced uses the server's own priority score. Speed to Market sorts by lowest effort first. Risk Reduction puts critical-risk items on top. ROI ranks by readiness impact per rupee of budget.
3
Model a decision
Check off any combination of items and the What-If panel calls the same projection engine the dashboard uses to show current versus projected readiness, live.
4
See the trade-off visually
Switch to Matrix view to plot impact against effort, with quadrant lines set at your org's own median values, not arbitrary cutoffs.
See it in the platform
Portfolio scenario · Illustrative
Vendor risk reviewcritical
92 impactAccess control rolloutcritical
85 impactModel drift monitoringcritical
78 impactVendor contract renewalMissing Team Size
55 impactDocs & runbooks
40 impactRisk Reduction view: 3 initiatives carrying a critical risk moved to top
Frequently asked
Who this helps
The CTO
Sees which initiatives actually move the readiness needle before allocating engineering time, instead of relying on whoever presented most recently.
The CFO or Finance Lead
Gets an ROI-per-rupee ranking built from the same budget figures already entered on each initiative, with no separate spreadsheet to maintain.
The Program or PMO Lead
Can re-rank the entire portfolio by risk or speed in one click when priorities shift, without re-running a manual review cycle.
Related products